
My Projects and Achievements
Python
1. Executive Summary
An AI-powered automated tool called DataParrot-Home Remittance Analyzer was created to drastically modernize and enhance the compliance monitoring mechanism for large-scale home remittance transactions. The technology uses a specialized machine learning model to identify hidden business names, automatically detects split transactions, and indicates instances in which a single remitter transfers money to the same beneficiary more than five times in a single month. This function is essential since only eligible home-remittance transactions qualify for a fixed rebat of SAR 20 per eligible transaction under the most recent TT Charges Reimbursement Scheme announced by State Bank Pakistan . Multiple transfers from the same remitter to the same recipient on the same day or over the course of a month must be consolidated or restricted in order to qualify, and the remittance amount must meet a minimum threshold. Financial institutions must make sure that both remitter and beneficiary names are correct and that remittance transactions are authentic, not illicitly split or duplicated to get around scheme limits, in order to submit legitimate claims for reimbursement under SBP's plan. Therefore, it is essential to streamline the detection of split or recurring transfers in order to prevent financial loss, avoid invalid rebate claims, and maintain regulatory compliance. Compliance staff manually investigated more than a million transactions prior to the implementation of DataParrot. A process that required a significant amount of staff time, took one to two weeks, and had a high chance of oversight and human mistake. DataParrot's automation reduces processing time to five to ten minutes, improves accuracy and consistency, and produces outputs that are audit-ready. DataParrot demonstrates applied AI innovation in banking operations while supporting operational efficiency, regulatory compliance, and financial accuracy.
Intelligent Branch Audit Monitoring & Reporting Platform
1. Executive Summary
The Desktop Audit Automation System is a fully automated, AI-assisted audit monitoring platform developed to modernize and optimize the branch audit process. The system connects directly with Oracle databases, extracts branch-level operational and compliance data, processes it using advanced data engineering techniques, and generates standardized Excel reports along with a fully formatted observation report in Word format.
Prior to automation, a single branch desktop audit required up to 15 working days and significant manual effort from audit officers. Due to operational constraints, the department could cover only approximately 40 branches annually.
With the implementation of this system:
- Audit completion time reduced from 15 days to 20 minutes
- Annual audit coverage increased from 40 branches to 200+ branches
- Manual report drafting eliminated
- Observations standardized and dynamically generated
- Risk detection logic embedded into the system
The project represents applied AI, data engineering, and automation excellence in banking audit operations.
Automated Continuous Audit Reporting Framework
1. Executive Summary
The Continuous Audit Automation System was developed to modernize and streamline the monitoring of operational and compliance risks across the bank's branches through automated continuous audit reporting.
The project automates 13 critical continuous audit reports that were previously generated through manual data extraction and analysis. These reports are downloaded from the Oracle Business Intelligence Enterprise Edition (OBIEE) reporting system and processed automatically using a Python-based automation framework.
The system performs data extraction, transformation, exception identification, and automated report formatting, followed by distribution of the finalized reports to the audit team through automated email notifications.
Before automation, auditors had to manually download reports, perform data analysis in spreadsheets, identify exceptions, and prepare formatted reports for review. This process was time-consuming, repetitive, and prone to human error.
With the implementation of this automation framework:
- Report generation time has been reduced significantly
- Exception detection is now fully automated
- Reports are standardized and formatted automatically
- Audit teams receive timely alerts for potential risk areas
The system demonstrates the effective use of Python-based automation in banking audit operations, improving efficiency, accuracy, and audit coverage.
Audit Automation Project
1. Executive Summary
Home remittances represent a critical source of foreign exchange inflows for Pakistan's banking sector. Financial institutions process a significant volume of international remittance transactions every month through various money transfer operators such as Western Union and other remittance partners.
To strengthen financial inclusion and increase customer acquisition, the President of Askari Bank initiated a strategic mission to convert remittance beneficiaries into formal banking customers. As part of this initiative, a specialized banking product called SDRA (Soni Dharti Remittance Account) was launched.
The purpose of the SDRA product is to enable remittance beneficiaries to receive their international remittances directly into a bank account rather than collecting funds through Cash Over Counter (COC). This approach improves accessibility, transparency, financial inclusion, and customer convenience.
However, a major operational challenge existed. Many beneficiaries were repeatedly receiving remittances through COC transactions but were not being converted into bank customers.
To address this issue, the Audit Department was assigned the responsibility to monitor all Home Remittance COC transactions and identify beneficiaries who were still not registered as bank customers.
To support this initiative, an automated audit monitoring system was developed that:
- Collects remittance data from multiple Oracle-based databases
- Processes and analyzes beneficiary transactions
- Identifies beneficiaries receiving remittances through COC
- Detects beneficiaries who are not registered as bank customers
- Automatically generates email alerts to the concerned branch requesting explanation
The automation significantly improves monitoring efficiency, strengthens internal controls, and supports the bank's strategic objective of expanding its customer base through remittance channels.
Basic Portfolio Projects
Power-BI Dashboard
1. Requirements Gathering:
- Identify key stakeholders.
- Collaborate with stakeholders to define specific metrics and KPIs relevant to the business goals.
- Determine the preferred Monthly time intervals for data analysis.
2. Data Collection and Integration:
- Collect Data
- Ensure data accuracy and consistency.
3. Dashboard Design:
- Choose a dashboarding tool (Power BI).
- Design a user-friendly interface with a clear layout for each card.
- Incorporate visual elements such as charts, graphs, and maps.
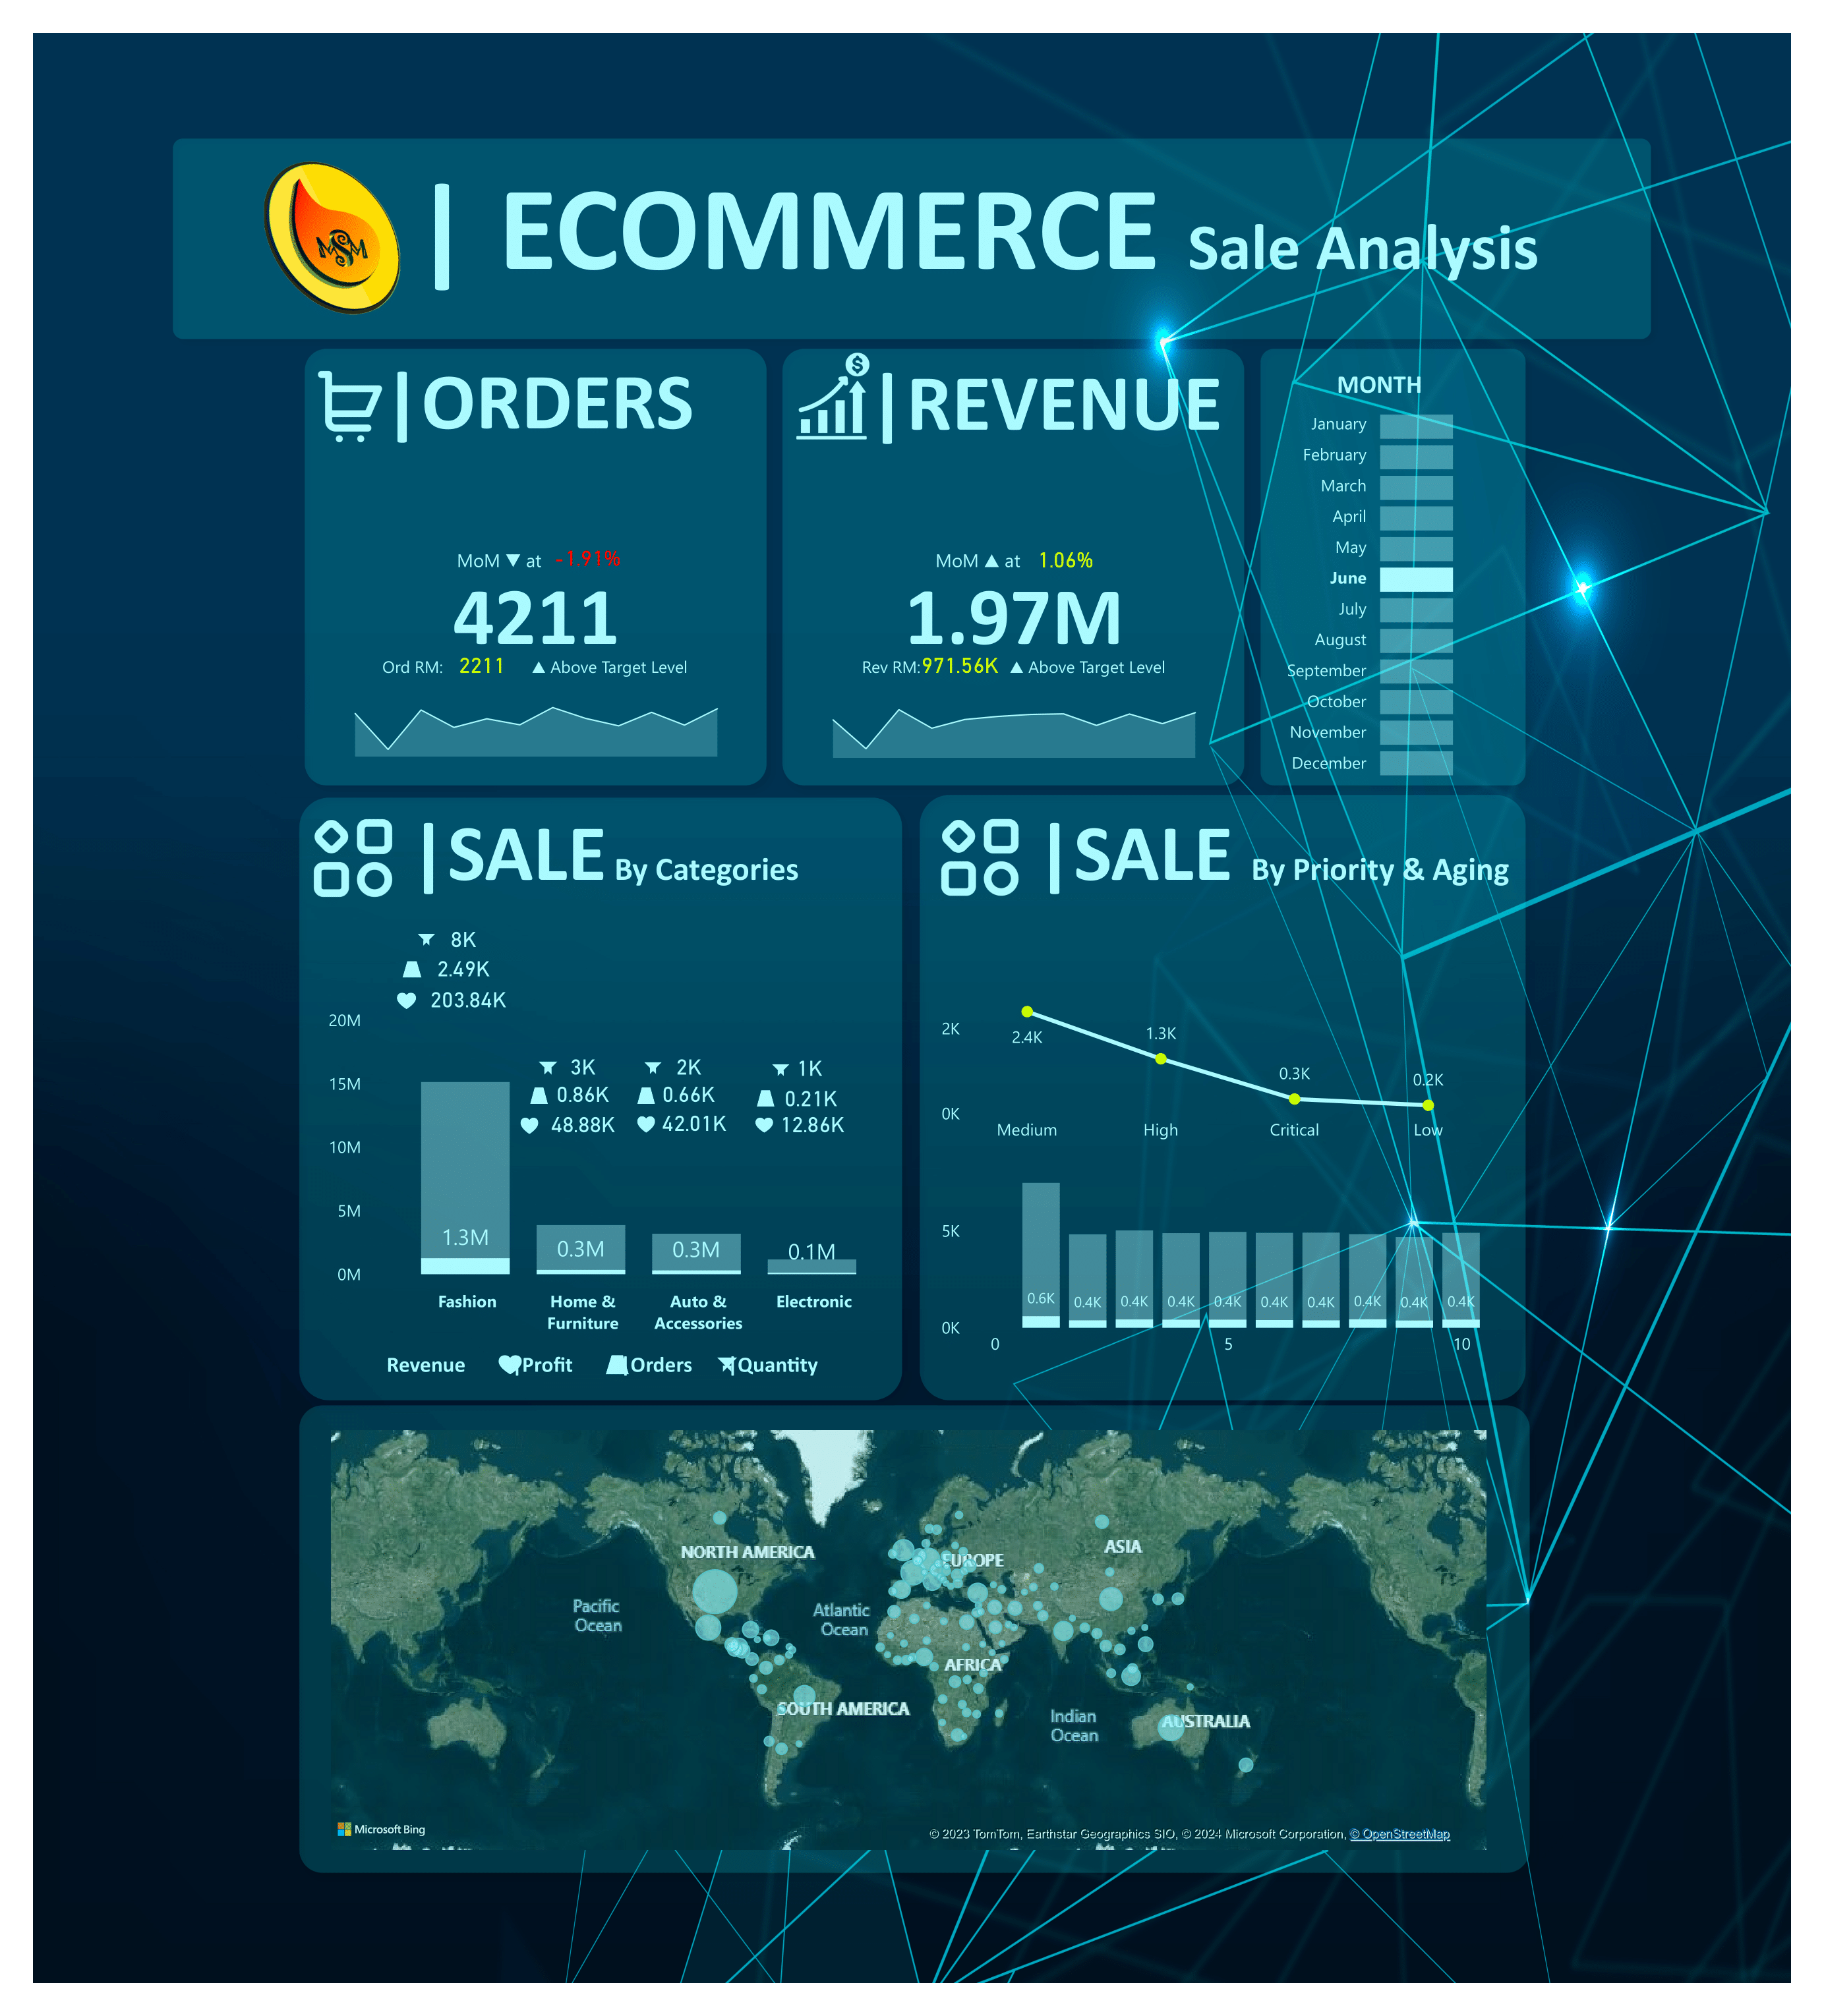
4. Revenue Card:
- Implement widgets for Total Revenue, MoM, and Monthly Target.
- Ensure real-time updates for accurate information.
5. Order Card:
- Develop widgets for Total Orders, MoM, and Monthly Target.
- Include features for easy comparison and trend analysis.
6. Sale by Category Card:
- Create visualizations for Total Revenue, Total Orders, Total Profit, and Total Quantity Sold for each product category.
- Implement interactive elements for drill-down analysis.
7. Sale by Priority and Aging Card:
- Design widgets to display Total Order by Sale and Total Order by Aging.
- Provide filters for priority levels and aging categories.
8. Map Card: Sale by Country:
- Integrate geographical data and create a map visualization.
- Display sales distribution by country and provide insights into global performance.
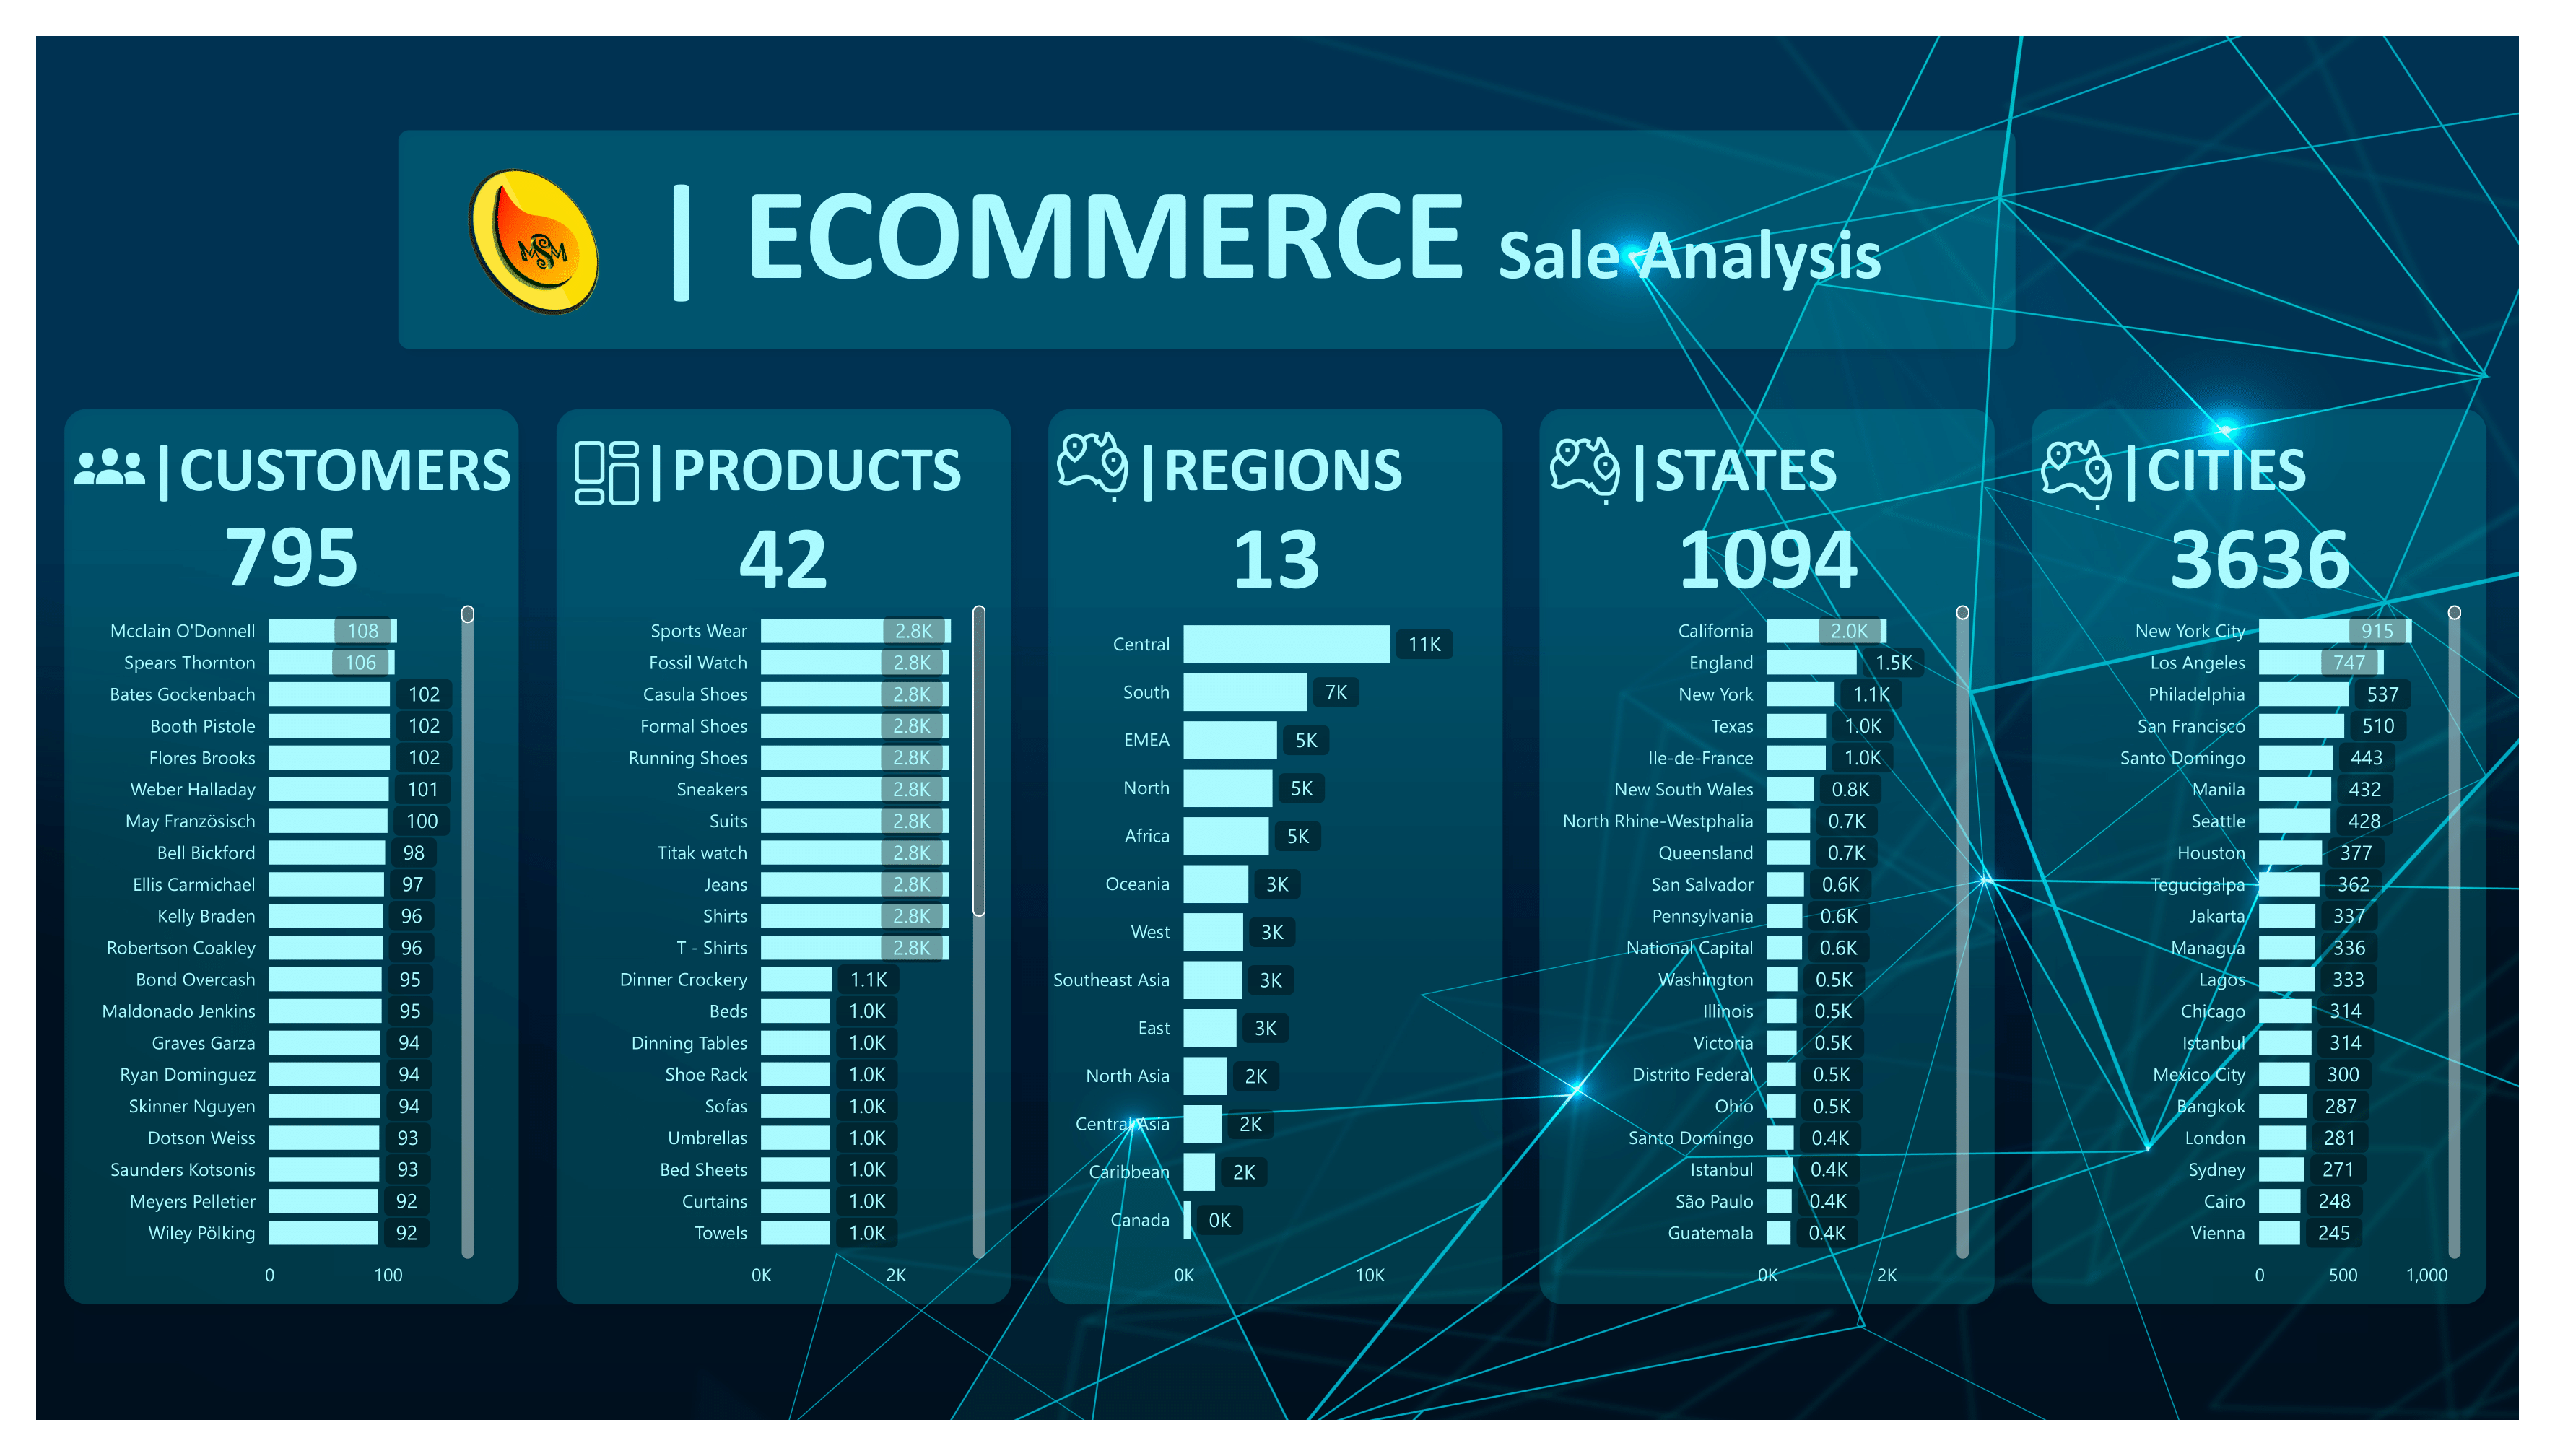
9. Five Performance Cards:
- Display sales performance by Customers, Product, Region, State and Cities.
- It provides details performance of each card.
9. Testing:
- Conduct thorough testing to ensure data accuracy and dashboard functionality.
- Gather feedback from stakeholders and make necessary adjustments.
Why this Dashboard Matters for our Client:
- Informed Decision-Making: Empowering our client’s team with real-time data for strategic decision-making.
- Performance Tracking: Enabling our client to monitor key performance indicators to drive growth and achieve targets.
- Global Insight: Understanding sales trends across different regions for effective market expansion.


Diversity & Inclusion Dashboard
Power-BI Dashboard
The Diversity and Inclusion Dashboard in Power BI incorporates a wide range of key performance indicators (KPIs) to effectively assess and monitor an organization’s diversity and inclusion efforts. The following KPIs are included:
Hiring Rate: The Hiring Rate KPI measures the percentage of diverse candidates hired over a specific period. It helps organizations track the success of their recruitment strategies in attracting and selecting candidates from diverse backgrounds.
Promotion Rate: The Promotion Rate KPI evaluates the percentage of diverse employees who have been promoted within the organization. This metric helps assess whether opportunities for advancement are equally accessible to all employees, regardless of their demographic characteristics.
Turnover Rate: The Turnover Rate KPI measures the percentage of diverse employees who have left the organization during a given period. Understanding turnover patterns among diverse groups can help identify potential issues in employee retention and engagement.
Performance Rating Distribution: This KPI provides insights into the distribution of performance ratings among diverse employees. Analyzing this data helps ensure that performance evaluations are fair and unbiased, contributing to a more inclusive performance management process.
Executive Gender Balance: The Executive Gender Balance KPI tracks the representation of different genders within the organization’s executive or leadership team. Achieving gender balance at the top levels is essential for demonstrating commitment to diversity and ensuring diverse perspectives in decision-making.
Age Group Representation: The Age Group Representation KPI examines the age diversity within the workforce. It helps organizations assess whether age-related biases are affecting recruitment, retention, or career development opportunities for employees of different age groups.
Power-BI Dashboard
This portfolio project on medical billing data analysis showcased my expertise as a data analyst in the healthcare domain. By identifying correlations between payments and charges, and exploring the impact of key metrics on the organization’s financial health, I provided valuable insights to support decision-making processes and improve financial stability. The findings from this project can be used to forecast revenue, optimize collection strategies, negotiate client contracts, and address outstanding balances effectively.


Power-BI Dashboard
My latest project , a fully functional Call Center Dashboard in Power BI!
As a testament to the power of data-driven decision-making, this dashboard empowers call center managers and supervisors to gain valuable insights into their operations, optimize agent performance, and enhance customer satisfaction.
With visually appealing charts and interactive features, the Call Center Dashboard provides real-time and historical analytics on key performance indicators such as:
1 : Track the number of incoming calls, identify peak hours, and adjust staffing levels accordingly.
2 : Measure the time taken to answer calls, ensuring efficient call handling and reducing customer wait times.
3 : Understand how long calls typically last, identify outliers, and identify opportunities for improvement.
4 : Monitor the percentage of calls successfully resolved, ensuring customer issues are addressed effectively.
5 : Evaluate individual agent performance metrics, identify top performers, and provide targeted coaching and training.
6 : Capture and analyze customer satisfaction ratings, enabling proactive steps to improve service quality.
Power-BI Dashboard
A top-level KPI dashboard for Northwind Traders that provides an overview of the company’s performance in key areas.
1 : Discount has a positive impact on revenue and sales.
2 : Quarter-1 of 2015 stood out as the highest revenue-generating quarter.
3 : The product category that experienced the highest sales is Beverages.
4 : The highest-selling product is Raclette Courdavault.
5 : Savea is the customer that placed the most orders.
6 : The delivery status of total orders indicates that 793 orders were delivered on time, while 37 orders were delivered late.
7 : Federal Shipping is identified as the fastest shipper company based on the average delivery time.
These are just some of the key performance indicators (KPIs) that can provide valuable insights into Northwind Traders’ performance across various areas. The actual selection and customization of KPIs may vary based on the company’s specific goals, industry, and strategy.


Power-BI Dashboard
A dynamic sales dashboard built using Power BI! I am thrilled to showcase my skills in data visualization and analysis through this project. With a clean and intuitive design, this dashboard allows you to easily track and monitor your sales data. Gain valuable insights into your business’s performance, spot trends, and identify areas for improvement. The interactive visuals and real-time updates provide a seamless experience, enabling you to make data-driven decisions with confidence. This project demonstrates my proficiency in Power BI and showcases my ability to transform complex data into actionable insights.
Power-BI Dashboard
I have successfully completed the Maven Pizza Challenge, a Power BI dashboard project. This project showcases my skills in data visualization and analysis, as well as my ability to leverage Power BI to create insightful and user-friendly dashboards.
The Maven Pizza Challenge involved analyzing various data sets.Through careful data modeling and visualization techniques, I was able to extract valuable insights, such as identifying the most popular pizza toppings, finding order trend by day/time, and tracking sales performance over time.


Power-BI Dashboard
I have successfully developed an analytical dashboard using Power BI to monitor and understand attrition within our organization.
My Power BI analytic dashboard provides a comprehensive view of attrition within our organization and uncovers the underlying reasons behind it.
Through intuitive visualizations and interactive reports, I gain valuable insights into the factors contributing to employee attrition.
Power-BI Dashboard
I imported the survey responses into Power BI and removed any irrelevant or incomplete responses from the data. I combined and summarized the data as needed.
Then I started to Create visually appealing charts and graphs that represent the survey data in an easy-to-understand manner. Arranged the visualisations on a single page to create a dashboard. Added titles, labels, and interactive elements to make it user-friendly.


Microsoft Excel Dashboard
In this project, I designed and developed an interactive sales dashboard using Adidas data, aimed at providing comprehensive insights into sales performance. The dashboard offers multiple dimensions of analysis, including sales on a yearly and monthly basis, sales by region, sales by retailer, and the ability to filter data by product, year, and state.
Microsoft Excel Dashboard
Nizam Store Sales Boost Strategy: Empowering Women Shoppers in Maharashtra, Karnataka, and Uttar Pradesh!
After an extensive store sale analysis, I’m thrilled to present a game-changing strategy to enhance Nizam Store’s sales and drive growth!
For the final conclusion please click on project button.


Report: 2005 – 2020 | Python Dash Library
As an experienced data professional, I have successfully designed and developed a comprehensive dashboard using the Dash library called “US Domestic Airline Flights Performance.”
Through the implementation of interactive charts, graphs, and maps, the dashboard presents complex flight performance data in an intuitive and user-friendly manner. Users can easily filter data based on Yearly Airline Performance and Yearly Airline Delay reports.
Python
1. Conducted data cleaning and manipulation to ensure data quality and consistency.
2. Utilized pandas, matplotlib, and seaborn libraries for exploratory data analysis (EDA).
3. Identified potential customers across various states, occupations, genders, and age groups to enhance customer experience.
4. Determined the most selling product categories and products to optimize inventory planning and meet customer demands, thereby improving sales.
